SCIMaP Visualizes the True Cost of Science Funding Cuts

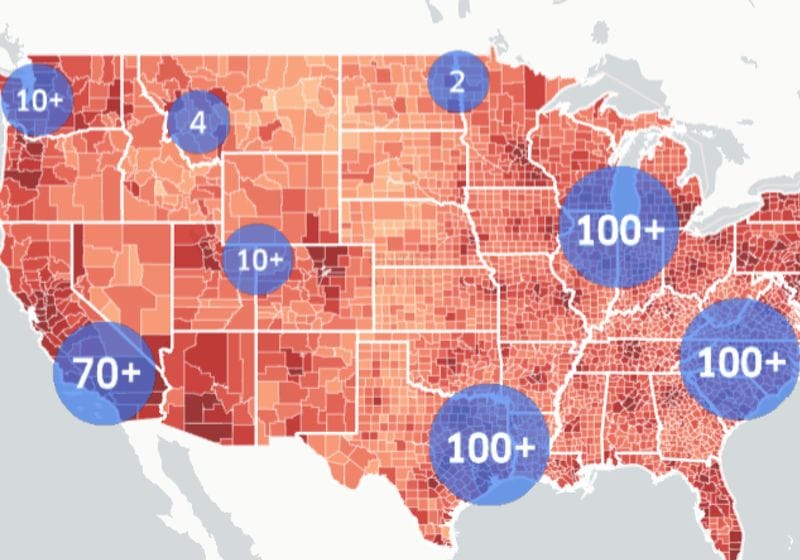
An interdisciplinary group of scientists created SCIMaP as an interactive tool to visualize the impact of federal health research cuts nationwide.
Image credit:SCIMaP, CC BY 4.0
Since early 2025, the Trump administration has disrupted science by freezing National Institutes of Health (NIH) grants and cutting research support, halting studies and threatening an infrastructure collapse. NIH funding supports a larger ecosystem of universities, hospitals, research institutions, and businesses. Experts fear that as a consequence of funding cuts, research will slow, training opportunities will disappear, and many jobs supported by this system will grind to a halt.
In response to these sweeping changes, Joshua Weitza biologist at the University of Maryland, collaborated with an interdisciplinary group of researchers to take action.1 “We felt that one of the issues here was that there was a missing communication gap to try to explain to scientists, policy makers, and the public exactly how big and how extensive these impacts would be,” said Weitz.
Joshua Weitz and his interdisciplinary team developed SCIMaP to show how looming budget cuts threaten scientific progress, jobs, and the economy.
Joshua Weitz
Together, he and his colleagues translated the funding cuts into an interactive, data-driven map to visualize the deep impact of these cuts at the national, state, and local level. This Science & Community Impacts Mapping Project (SCIMaP), which was launched on March 27, 2025, is an ongoing effort to reflect cuts to research, infrastructure costs, grant freezes and terminations, as well as the fiscal year 2026 (FY26) NIH budget proposal.
To create this visual map highlighting the local impacts of changes to federal science funding, Weitz drew on his previous experiences developing public-facing projects, where he communicated infection risk through interactive maps on a website during the COVID-19 pandemic.2 In that effort, he collaborated with cognitive neuroscientist Alyssa Sinclair at the University of Pennsylvania and geographical information scientist Clio Andris at the Georgia Institute of Technology. Their experience in interactive mapping carried over into SCIMaP, which also included contributions from scientists at the University of Oregon and the University of Utah.
Weitz and the team hope that SCIMaP serves as a resource to present the economic implications of these cuts on a more personal level. “Where do all these people work? They don’t just work in the county or right next to the institution that’s being hit, but they work in surrounding areas,” explained Weitz. “That’s how we end up generating these community impact maps. It’s also important because it flips a bit of the frame.”
The team gathered publicly available data on proposed cuts to NIH research funding (indirect costs)cancelled and frozen grants from the Grant Witness (previously Grant Watch) databaseand local economic impact data from census data records. Their analysis shows an estimated $16 billion in economic loss and 68,000 jobs lost nationwide from reductions to NIH grants. From the FY26 NIH budget proposal, SCIMaP depicts a projected economic loss of $47 billion and more than 200,000 jobs lost.
When users hover over their respective state, county, or congressional district, the map also depicts a breakdown of estimated economic loss from three NIH institutes: aging, cancer, and infectious disease. “Those three institutes are supposed to be retained from one fiscal year to the next, so we can make a comparison of what the projected cuts are,” explained Weitz. In addition to this, the map includes the corresponding US representative to encourage people to speak to their elected officials about these cuts.
Weitz added that the SCIMaP team is working to include a similar breakdown of affected National Science Foundation grants and impoundments—the non-distribution of funds that have been allocated. “Congress directed the executive branch to distribute these funds. What happens if they don’t? That’s another way that the American people are losing out, because funds that should have been distributed back to the state’s competitive process are not being distributed.”
Weitz and his colleagues hope that this map is shared as a resource to increase awareness about just how deep these budget cuts are currently and how they will affect communities. “We are continuing to do our part to build out more pieces to make sure that the information is available as broadly and accessibly as possible,” said Weitz.


